import streamlit as st
import pandas as pd
from palmerpenguins import load_penguins

penguins = load_penguins()

st.header("Penguin Dataset Explorer")

selected_rows = st.dataframe(penguins, on_select="rerun")

st.write(selected_rows)16 Bidirectional Inputs - Dataframes, Charts and Maps
In more recent versions of Streamlit, it has become possible to feed certain interactions with graphs - like selecting a series of points on a scatterplot - or with maps - like zooming to focus in on a subset of markers - back into the app.
This can allow you to do things like provide a dataframe below a map that responsively filters to only show the data relating to the points currently visible on a map.
This is a more advanced topic. It is recommended that you have become comfortable with inputs and outputs in Streamlit before attempting to use the contents of this chapter.
16.1 Dataframes
In the case of dataframes, maybe we want to allow users to easily select a subset of rows to be plotted on a graph or map, or use this subset of rows to calculate some summary statistics.
Let’s load in the penguins dataset.
Notice that we have now saved the output of st.dataframe to a variable, and also added the parameter on_select="rerun".
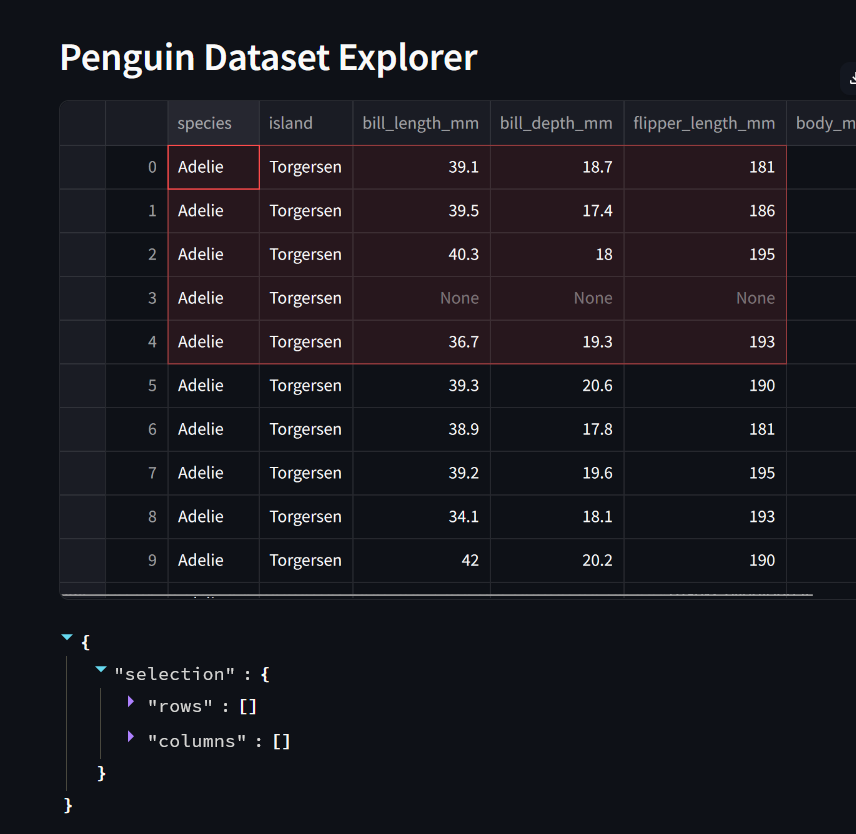
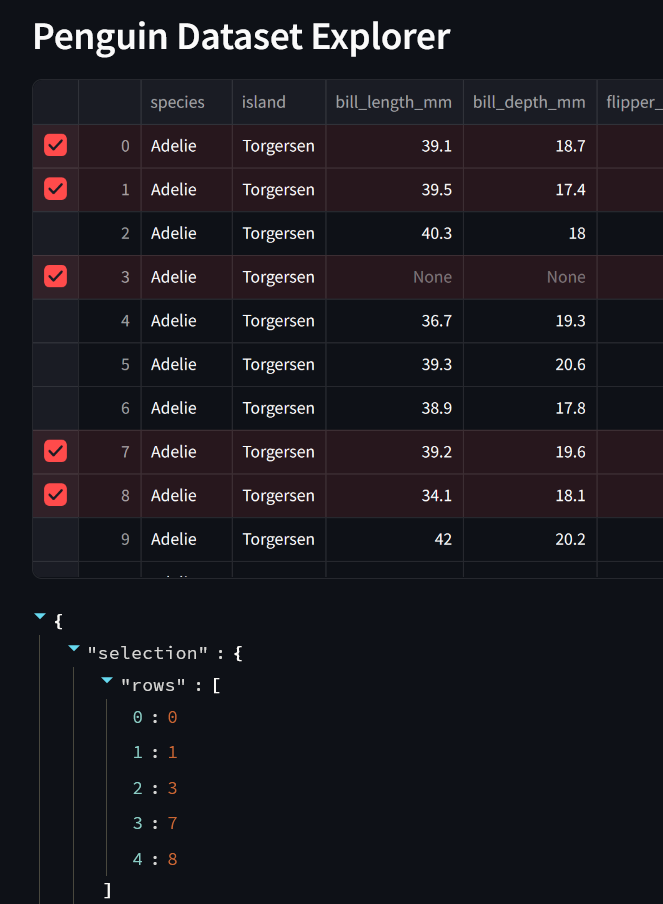
Before we start filtering by what is returned, let’s first just see what actually is returned and explore how this updates.
Note that selecting a subset of cells like this is not sufficient.

You must select the full rows using the dataset column at the far left, to the left of the index column if displayed.

We can then use the selected row indices to restrict the rows we use for subsequent calculations.
import streamlit as st
import pandas as pd
import numpy as np
import plotly.express as px
from palmerpenguins import load_penguins

penguins = load_penguins()

st.header("Penguin Dataset Explorer")

selected_rows = st.dataframe(penguins, on_select="rerun")

row_indices = selected_rows["selection"]["rows"]

print(f"You've selected {len(row_indices)} penguins")

filtered_df = penguins.iloc[row_indices]

st.write(f"Mean Weight: {np.mean(filtered_df['body_mass_g'])}")

st.plotly_chart(px.pie(
                pd.DataFrame(filtered_df['sex']).value_counts(dropna=False).reset_index(),
                values='count', names='sex', title="Sex of Selected Penguins")
                )

st.subheader("Your Filtered Dataframe")

st.dataframe(filtered_df)The selection_mode parameter can be passed to st.dataframe to allow selection of single or multiple rows, single or multiple columns, or some combination of the two.
Note that enabling column selection disables column sorting.
16.2 Graphs
Streamlit also supports monitoring st.plotly_chart, st.altair_chart, and st.vega_lite_chart for point selections and using this as an input for further actions.
In this book we focus on the use of plotly; take a look at the Streamlit documentation to see how this could work with the Altair and Vega Lite plotting libraries instead.
When hovering over the plot, users are given options such as ‘box select’ (to choose a box-shaped subset of points) or lasso select (to select an irregular set of points.)

Let’s start by creating a scatterplot of the penguins dataset.
Notice that we have now saved the output of st.plotly_chart to a variable, and also added the parameter on_select="rerun".
import streamlit as st
import pandas as pd
import plotly.express as px
from palmerpenguins import load_penguins

penguins = load_penguins()

fig = px.scatter(penguins, x="body_mass_g", y="bill_length_mm", color="species")

selected_data = st.plotly_chart(fig, on_select="rerun")

st.write(selected_data)
Now let’s see how we could use this to update some outputs.
import streamlit as st
import pandas as pd
import plotly.express as px
from palmerpenguins import load_penguins

penguins = load_penguins()

fig = px.scatter(penguins, x="body_mass_g", y="bill_length_mm")

selected_data = st.plotly_chart(fig, on_select="rerun")

selected_point_indices = [
    point
    for point
    in selected_data["selection"]["point_indices"]
    ]

st.dataframe(
    penguins.iloc[selected_point_indices, :]
)Here, we’ve just chosen a very simple example where there is no colour applied to the points in the graph.
If the color parameter is passed to px.scatter then the resulting point indices are related to the rows for that colour only - e.g. if we coloured by the species, then a point_index parameter of 139 wouldn’t relate back to an index of 139 in the original dataset - it would be point 139 for that particular species.
Always explore and test the outputs of your filtering carefully to ensure it’s returning what you think it’s returning!
As of the time of writing (August 2024), this feature is quite new and there are not many examples of more advanced usage of it.
16.3 Maps
For maps, we need to use the external streamlit_folium library, which must be installed via pip before use - it doesn’t come bundled with Streamlit itself.
16.3.1 Filtering with the bidirectional Folium Component
When using this component, data is constantly being returned as the map is updated.
Let’s take a look at what is being returned as the map is updated.
import geopandas
import pandas as pd
import matplotlib.pyplot as plt
import streamlit as st
import folium
from streamlit_folium import st_folium

gp_list_gdf_sw = geopandas.read_file("https://files.catbox.moe/atzk26.gpkg")

# Filter out instances with no geometry
gp_list_gdf_sw = gp_list_gdf_sw[~gp_list_gdf_sw['geometry'].is_empty]

# Create a geometry list from the GeoDataFrame
geo_df_list = [[point.xy[1][0], point.xy[0][0]] for point in gp_list_gdf_sw.geometry]

gp_map_tooltip = folium.Map(
    location=[50.7, -4.2],
    zoom_start=8,
    tiles='openstreetmap',
    )

for i, coordinates in enumerate(geo_df_list):

    gp_map_tooltip = gp_map_tooltip.add_child(
        folium.Marker(
            location=coordinates,
            tooltip=gp_list_gdf_sw['name'].values[i],
            icon=folium.Icon(icon="user-md", prefix='fa', color="black")
            )
     )

returned_map_data = st_folium(gp_map_tooltip)

st.write(returned_map_data)
16.3.1.1 Using the returned data
Let’s get the bounds of the map to filter a dataframe to just contain the points within the area the user has zoomed to.
import geopandas
import pandas as pd
import matplotlib.pyplot as plt
import streamlit as st
import folium
from streamlit_folium import st_folium

gp_list_gdf_sw = geopandas.read_file(
    "https://files.catbox.moe/atzk26.gpkg"
    )

# Filter out instances with no geometry
gp_list_gdf_sw = gp_list_gdf_sw[~gp_list_gdf_sw['geometry'].is_empty]

# Create a geometry list from the GeoDataFrame
geo_df_list = [[point.xy[1][0], point.xy[0][0]] for point in gp_list_gdf_sw.geometry]

gp_map_tooltip = folium.Map(
    location=[50.7, -4.2],
    zoom_start=8,
    tiles='openstreetmap',
    )

for i, coordinates in enumerate(geo_df_list):

    gp_map_tooltip = gp_map_tooltip.add_child(
        folium.Marker(
            location=coordinates,
            tooltip=gp_list_gdf_sw['name'].values[i],
            icon=folium.Icon(icon="user-md", prefix='fa', color="black")
            )
     )

returned_map_data = st_folium(gp_map_tooltip)

xmin = returned_map_data['bounds']['_southWest']['lng']
xmax = returned_map_data['bounds']['_northEast']['lng']
ymin = returned_map_data['bounds']['_southWest']['lat']
ymax =  returned_map_data['bounds']['_northEast']['lat']
gp_list_gdf_filtered = gp_list_gdf_sw.cx[xmin:xmax, ymin:ymax]

st.write(f"Returning data for {len(gp_list_gdf_filtered)} practices")

st.dataframe(
    gp_list_gdf_filtered[['name', 'address_1', 'postcode', 'Total List Size']]
    )